




Aberdeen
Discovery Findings Template for Web Design Studios
A discovery findings report a web design studio sends after discovery: what was measured, what it means, the routes forward and the one decision needed from the client.
Make it yours, in seconds
Every template is a starting point. Drag to shift colour, typography and layout — the live preview updates as you move.
Move the dots to shift colour, typography and layout. The preview updates live.
Get more from every document
Turn raw discovery research into a report your client can act on in one sitting. Metric cards, funnel charts, ranked findings, and a sign-off page keep the story tight and the decision clear.
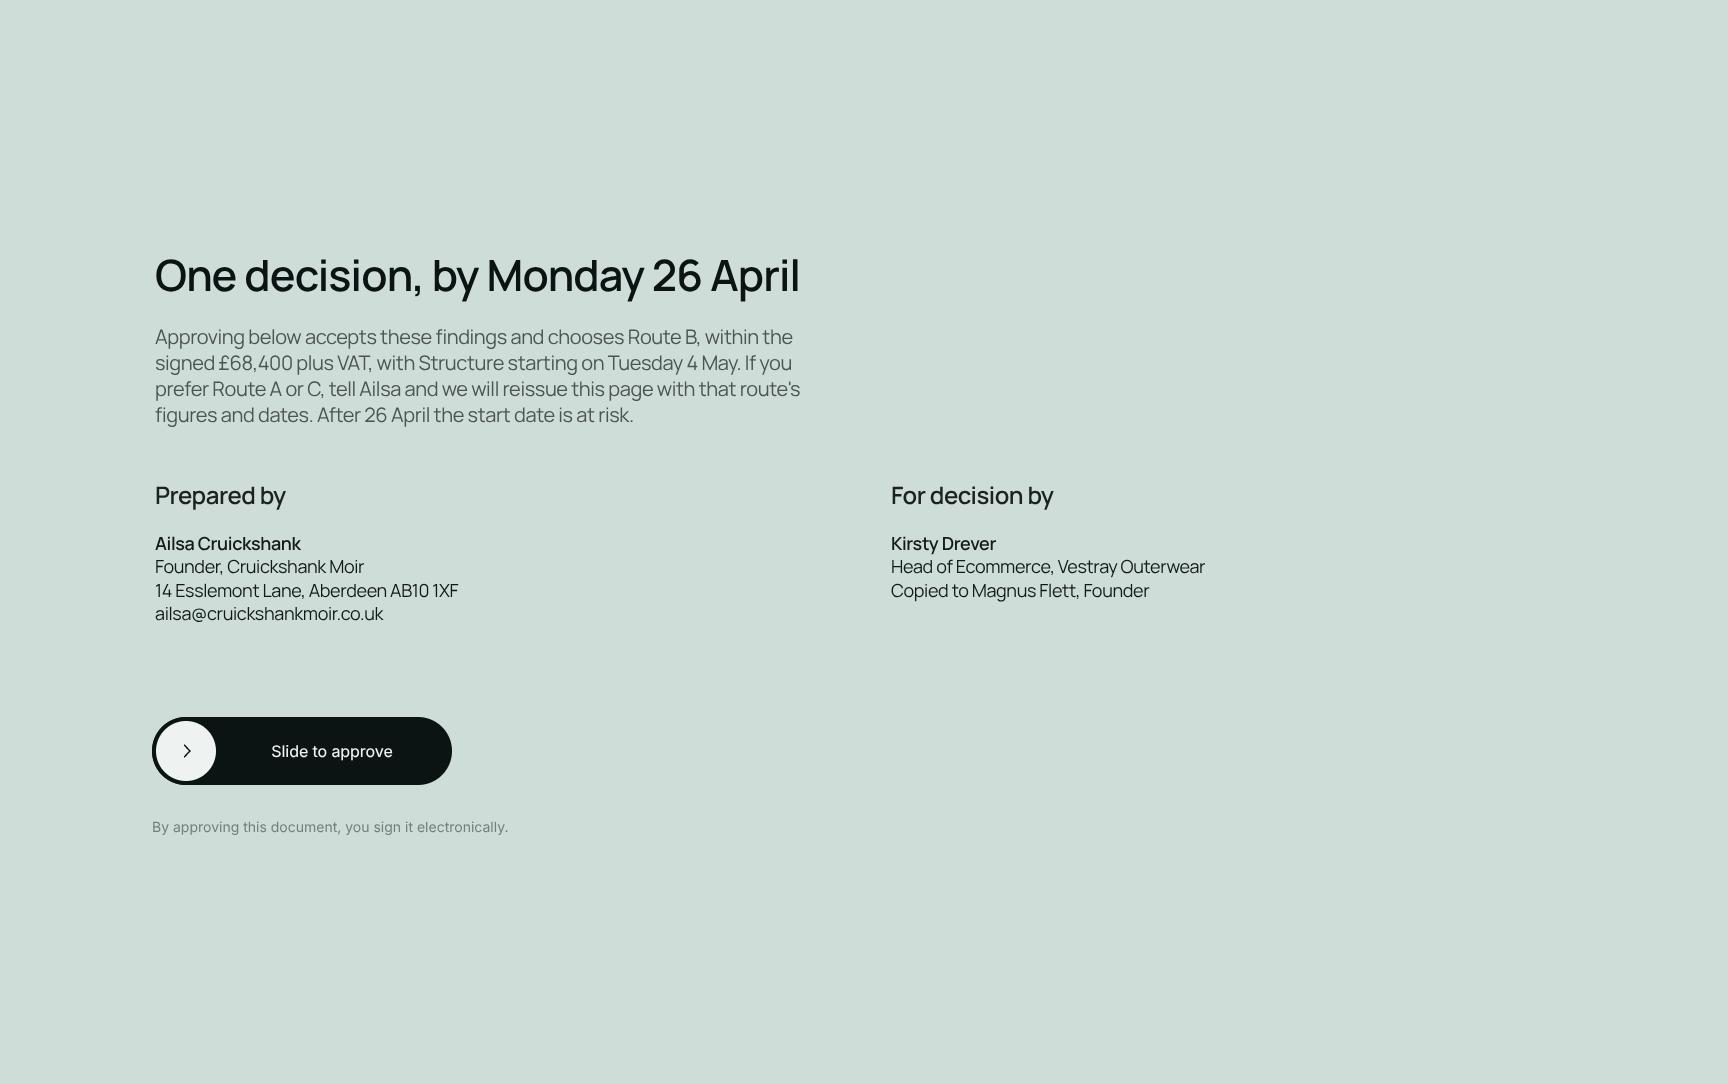
Get the report signed off in place
Your client reads the findings, then approves them in the agreement section at the end. No PDF export, no printing.
Build reports from blocks you trust
Drop in charts, breakdowns, and step sections, then save your best layouts and reuse them in your next report.
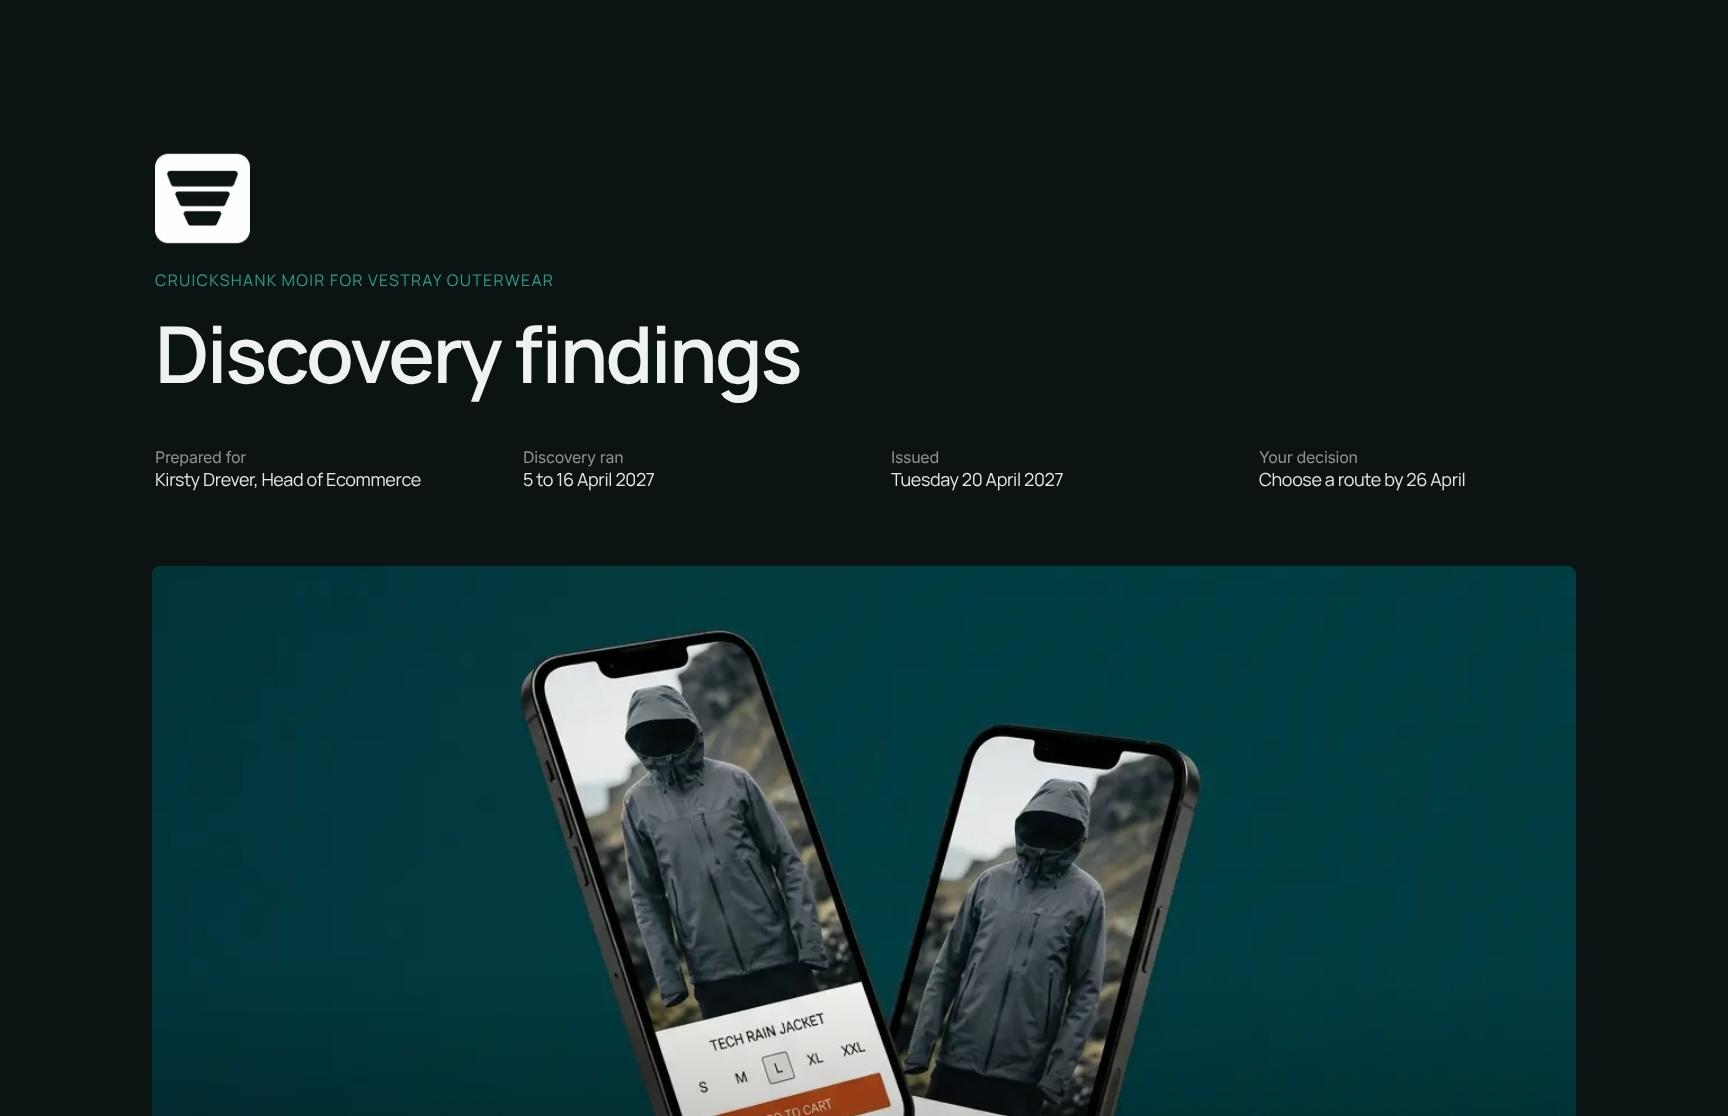
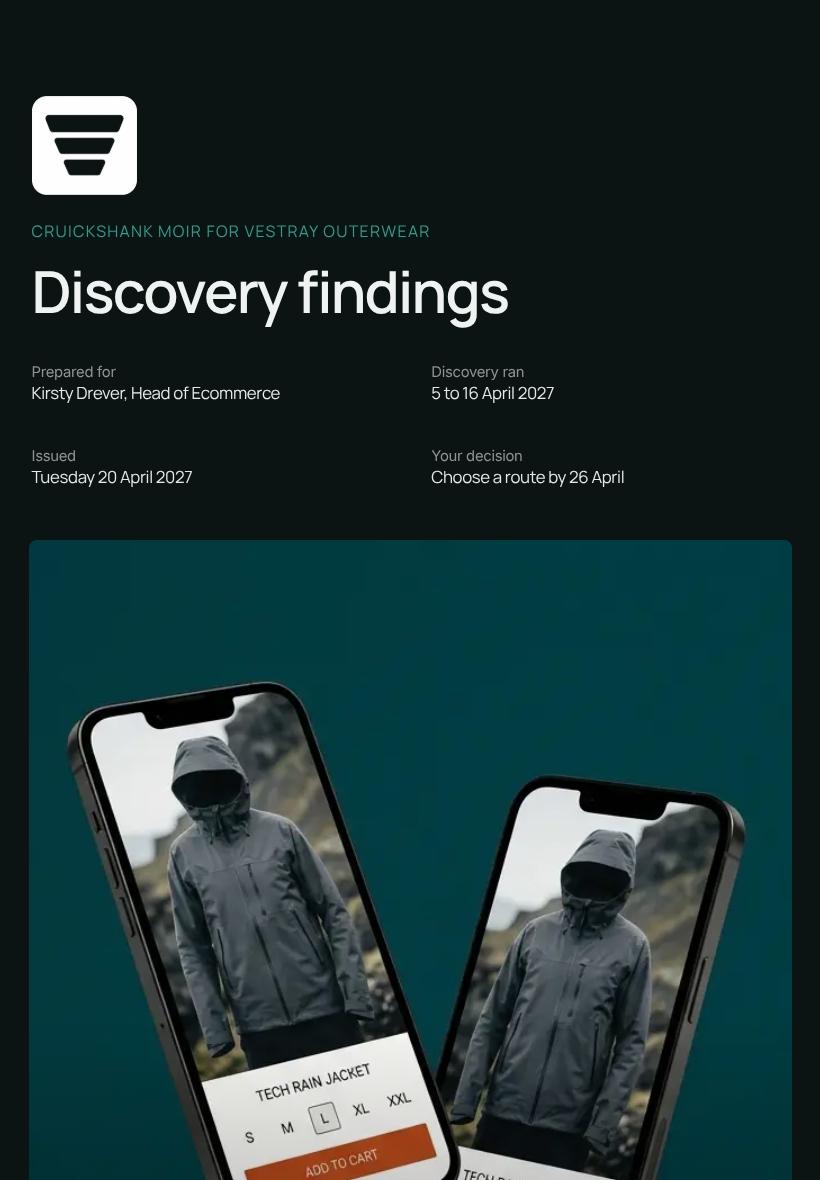

Charts that read well on phones
Your hero, charts, and accordions reflow for the laptop, the tablet, and the phone a client opens on the train.

See which findings your reader studies
Heatmaps show who lingers on the charts or skips the breakdown, so your follow-up call starts with what they care about.
Know when your report gets read
Get a ping when the client opens the report, comments on a chart, or signs the agreement.
Write the report together, live
One teammate tunes the charts while another rewrites the summary, and both of you watch the changes land.
See how every part fits
The report opens with the client brief and core question, builds through metrics, charts, and ranked findings, and closes on a route choice with an approval deadline. Keep what fits, drop what doesn't, and reorder anything.
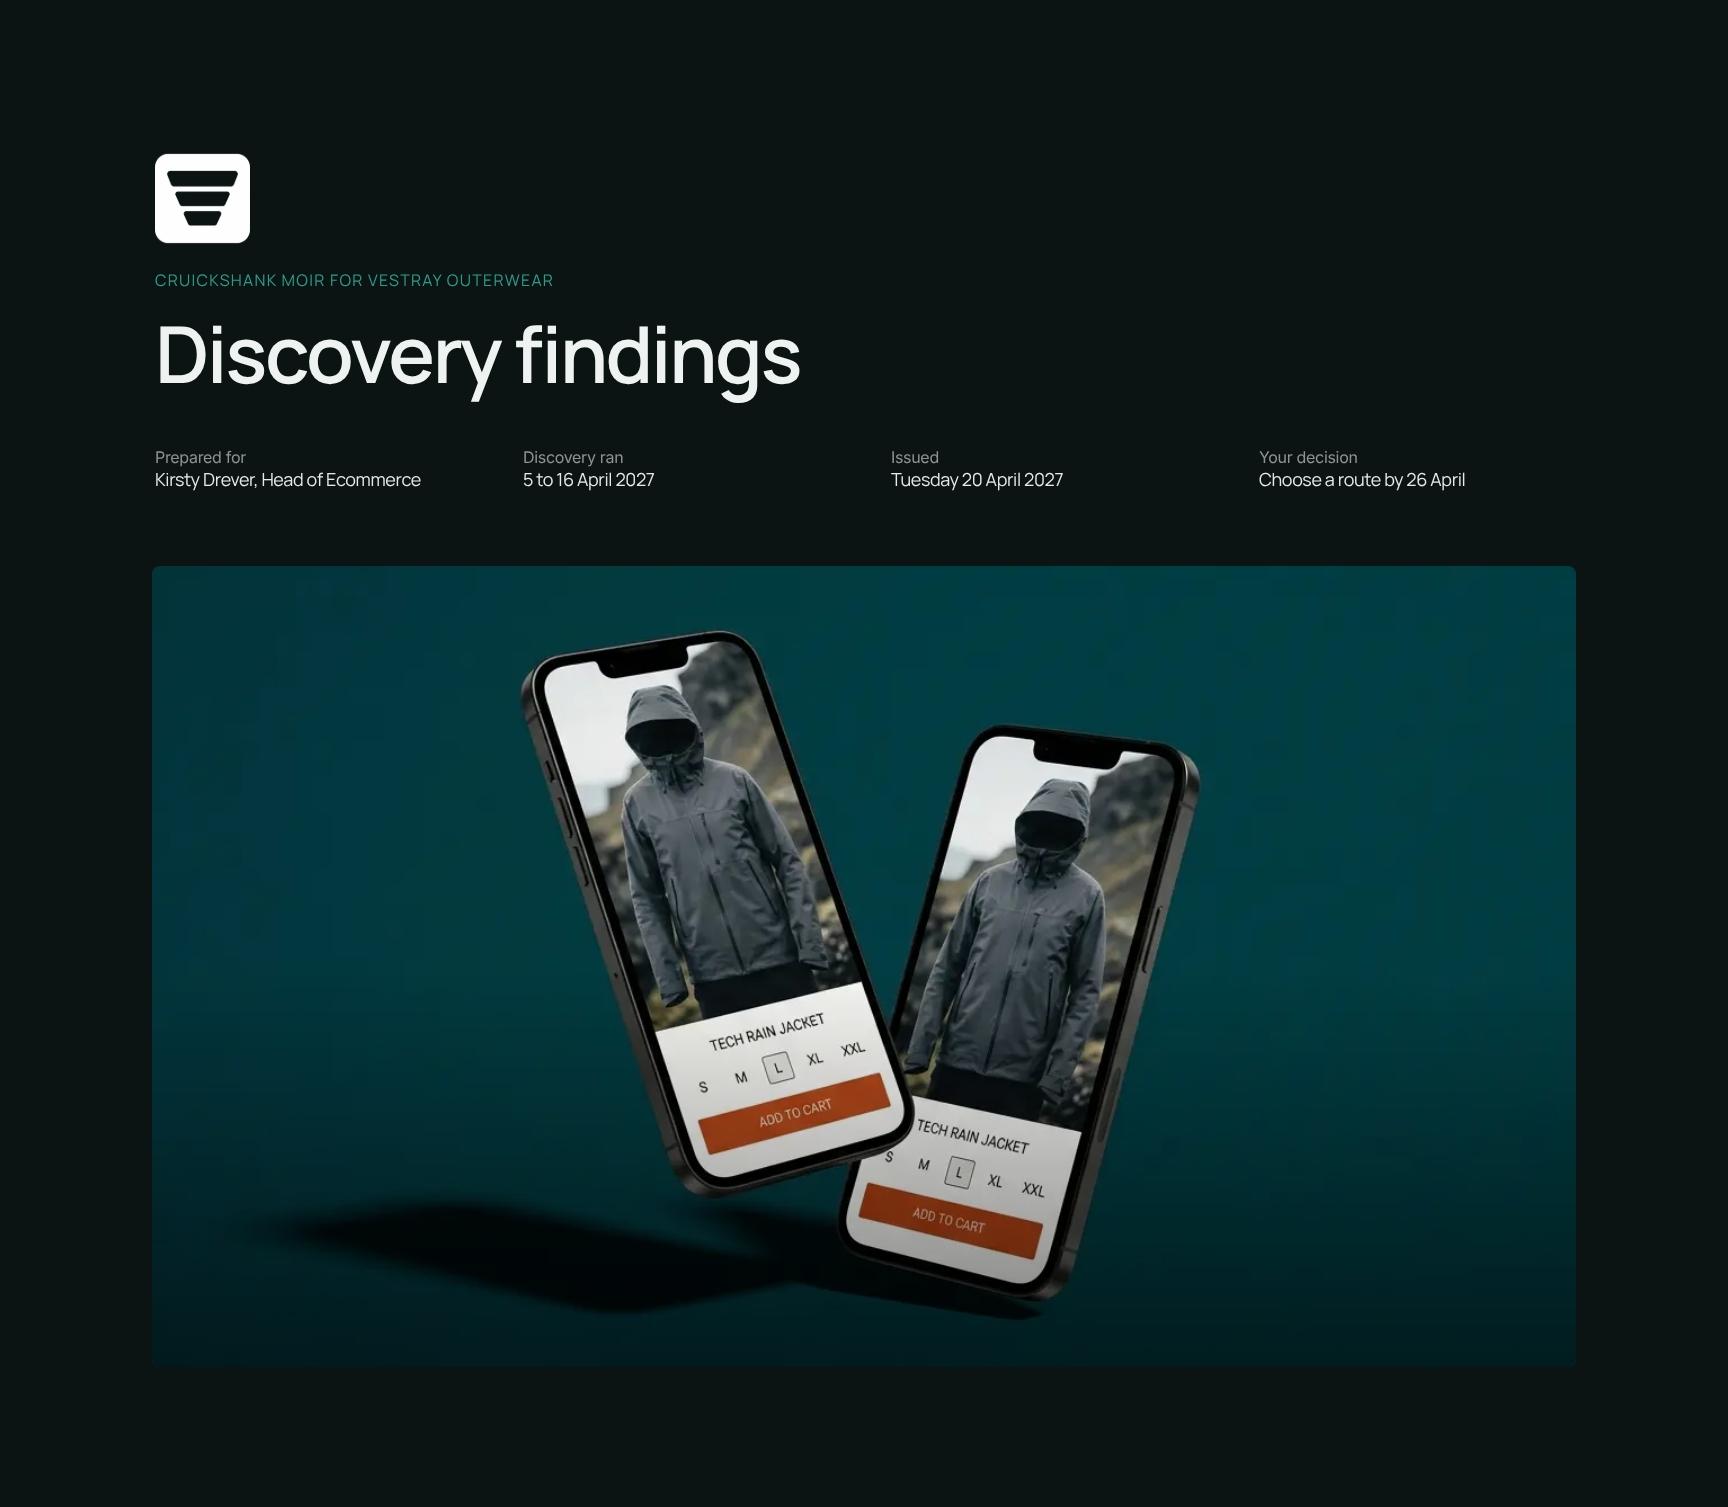
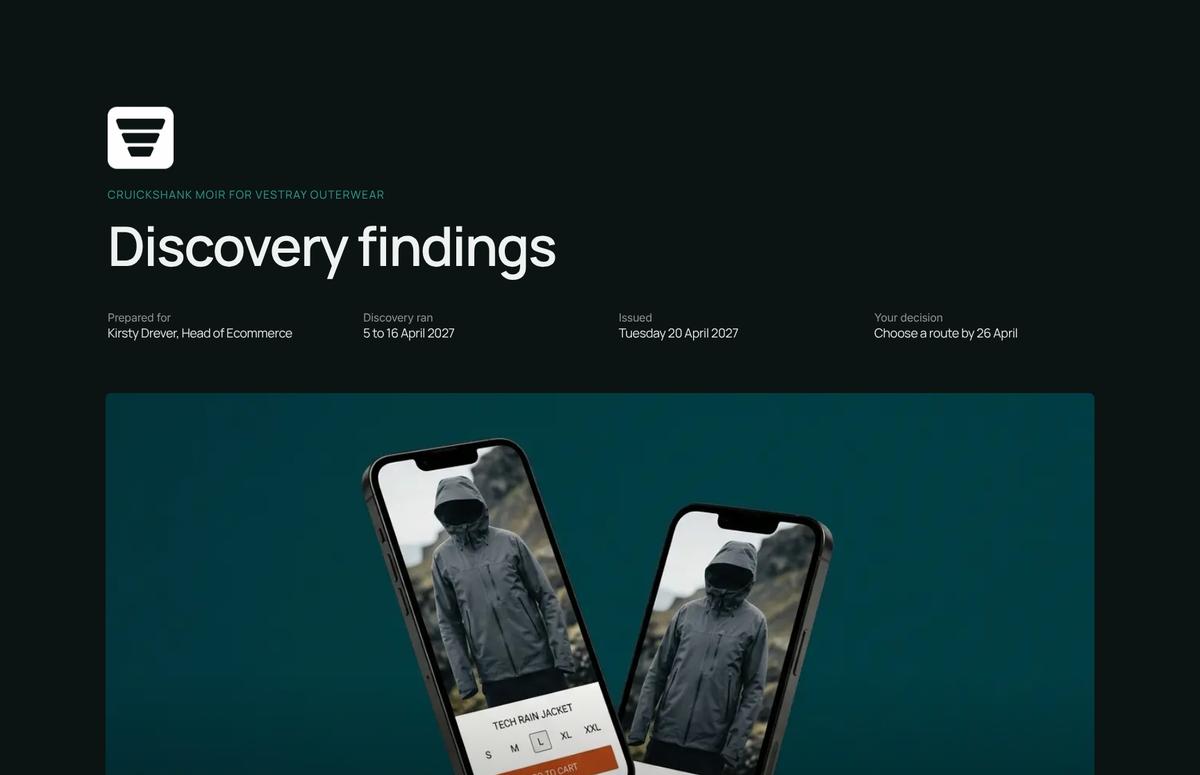
Discovery Findings Cover with Client, Dates and Scope
Opens the report with the agency and client names, the named recipient, and the discovery window of 5 to 16 April 2027. Sets context immediately so every stakeholder knows what this document covers.
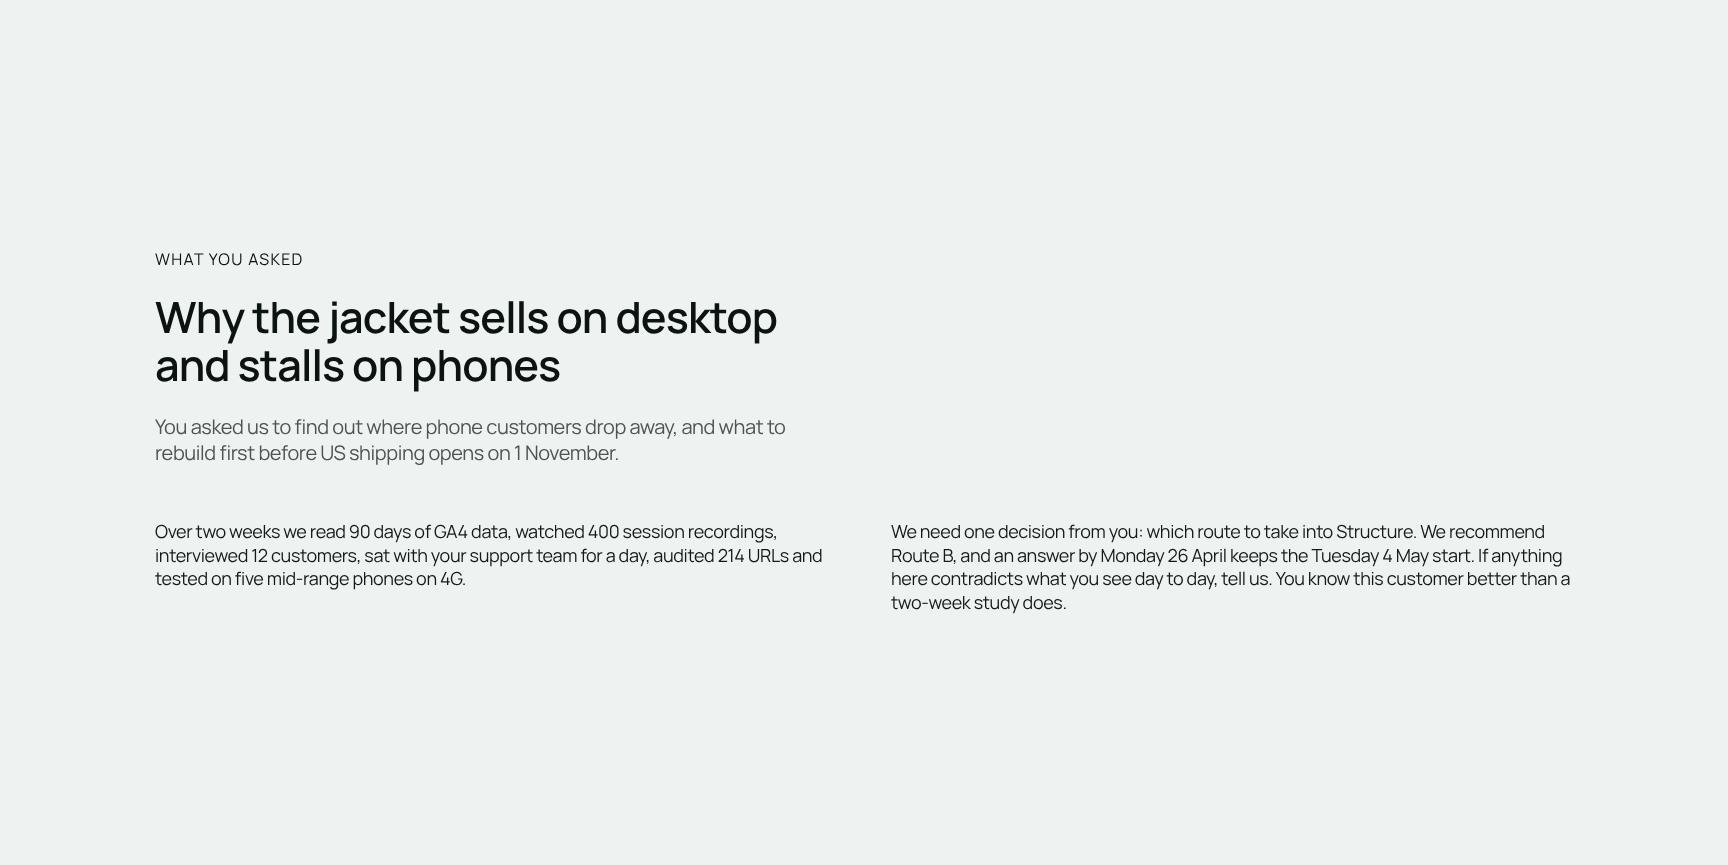
The Core Question: Mobile Conversion Brief and Deadline
Restates what the client asked: where phone customers drop away and what to rebuild first before US shipping opens on 1 November. Anchors the whole report to a clear business question and a hard deadline.
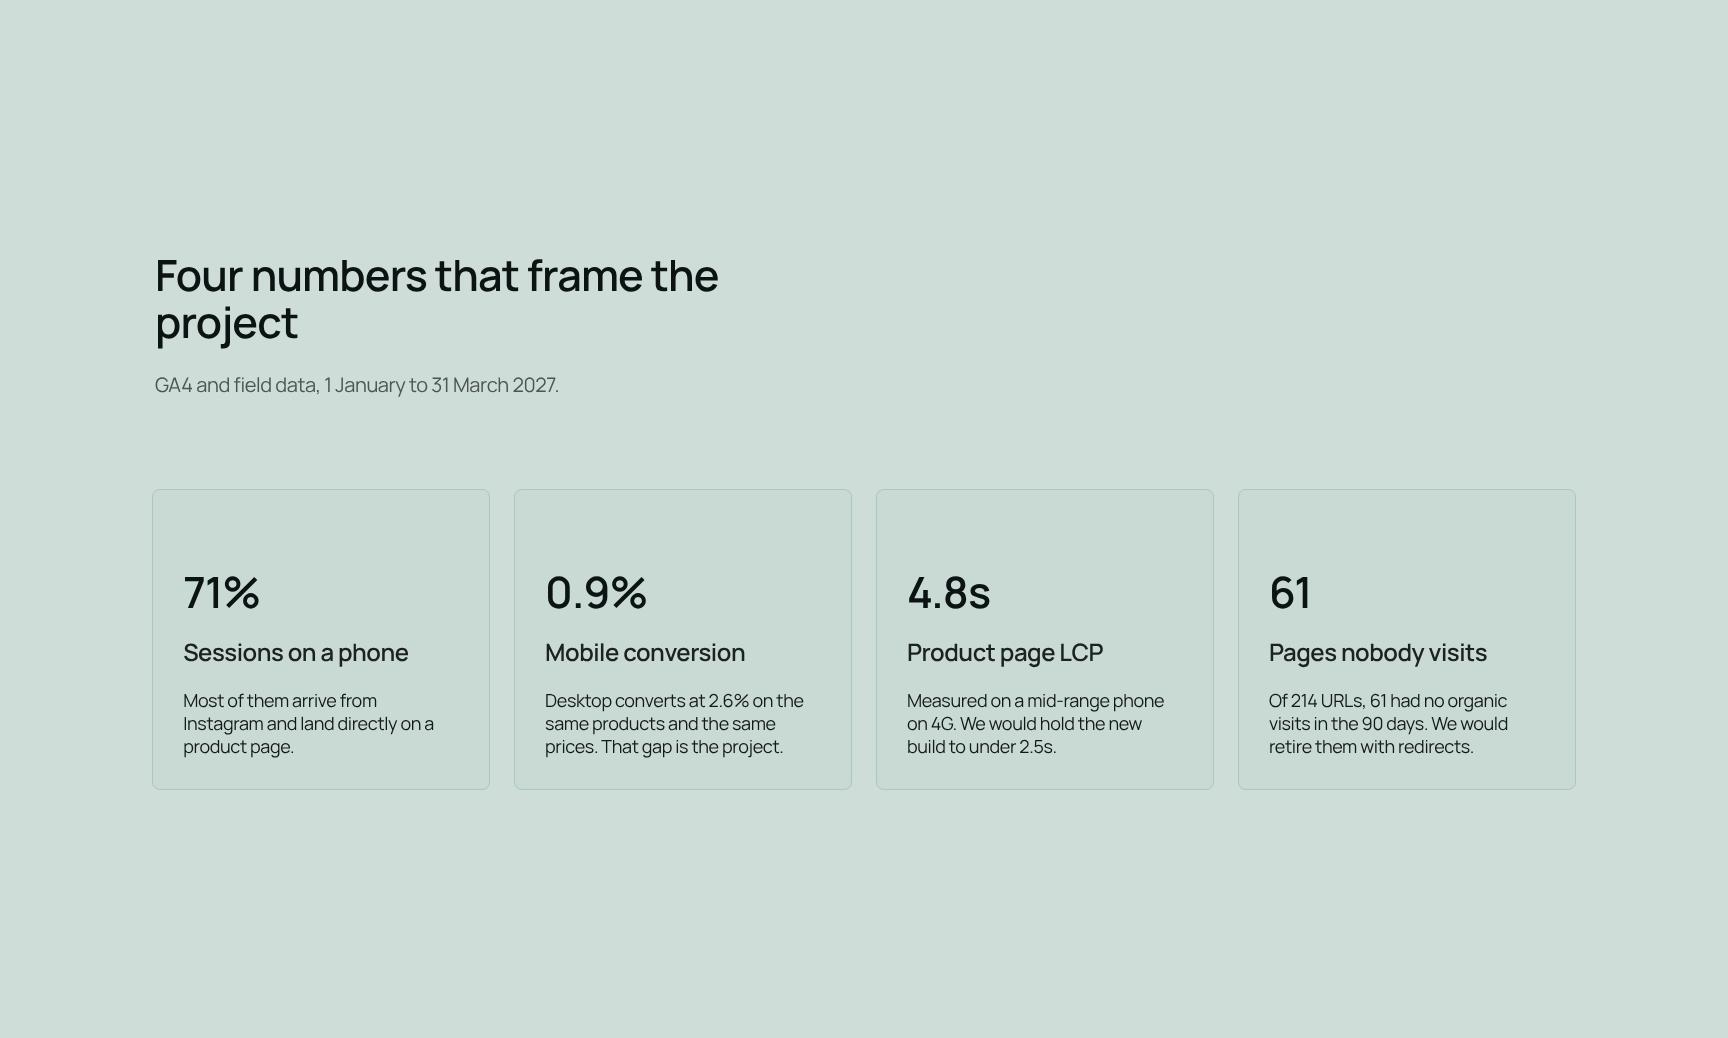
Key Metrics Cards: Four Numbers That Frame the Project
Four headline figures from GA4 and field data (1 January to 31 March 2027), with context on Instagram-driven product page landings. Gives executives a fast, evidence-based snapshot of the mobile problem.

The One Insight: Size Uncertainty Drives Mobile Drop-Off
An animated statement distilling the research into one memorable takeaway: customers trusted the jacket but left because a phone could not tell them which size to buy. Makes the central finding impossible to miss.
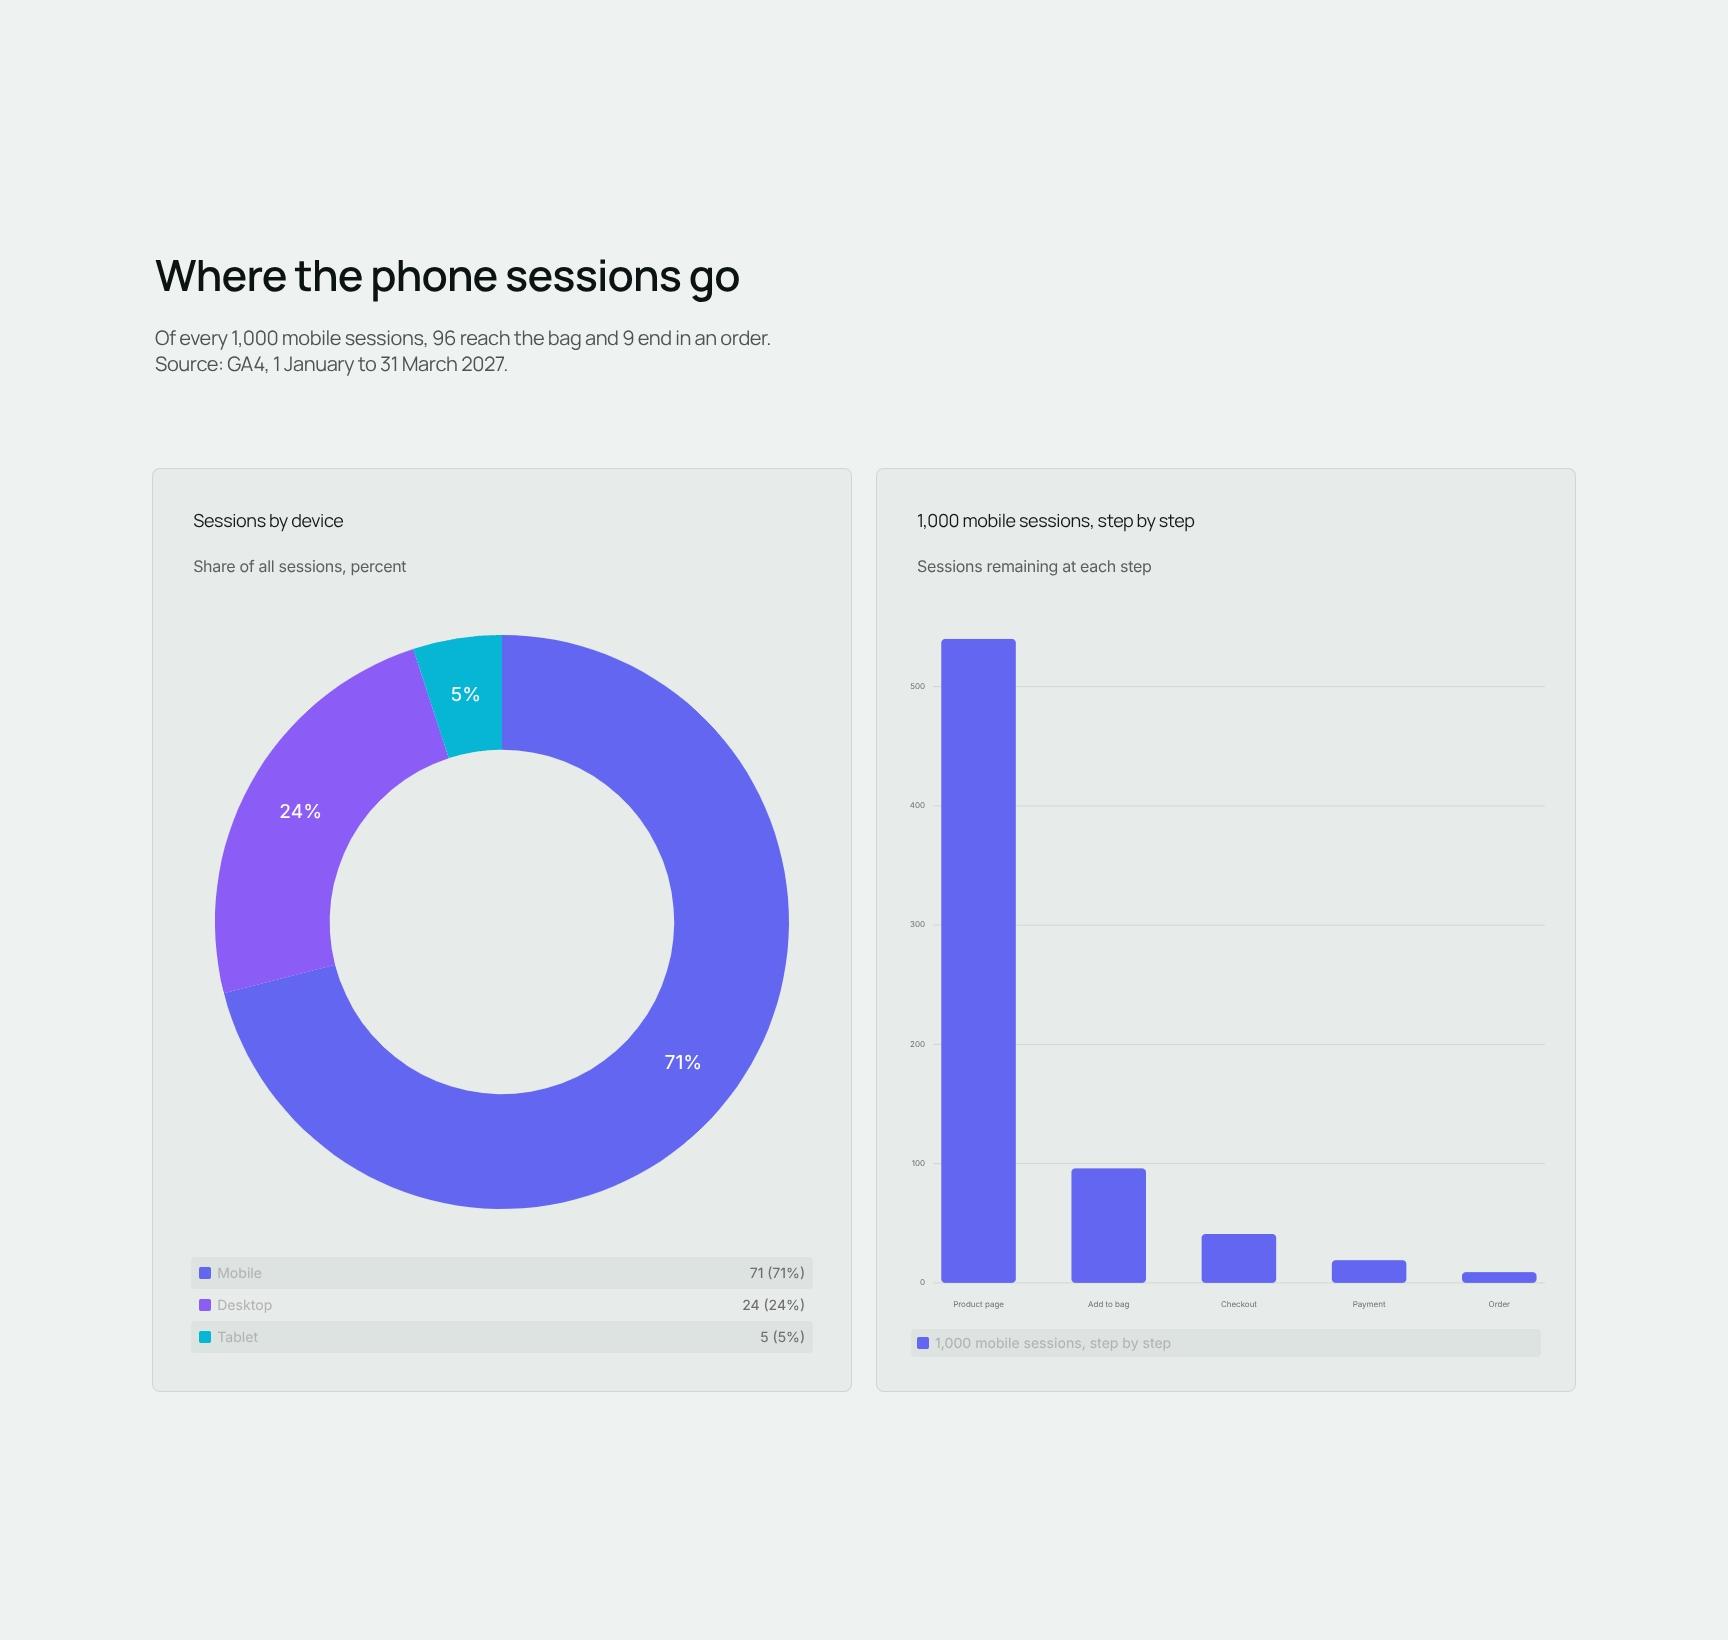
Mobile Funnel Charts: Where Phone Sessions Drop Off
Visualises what happens to every 1,000 mobile sessions: 96 reach the bag and 9 end in an order. Sourced from GA4, it pinpoints where revenue leaks so priorities rest on data, not opinion.
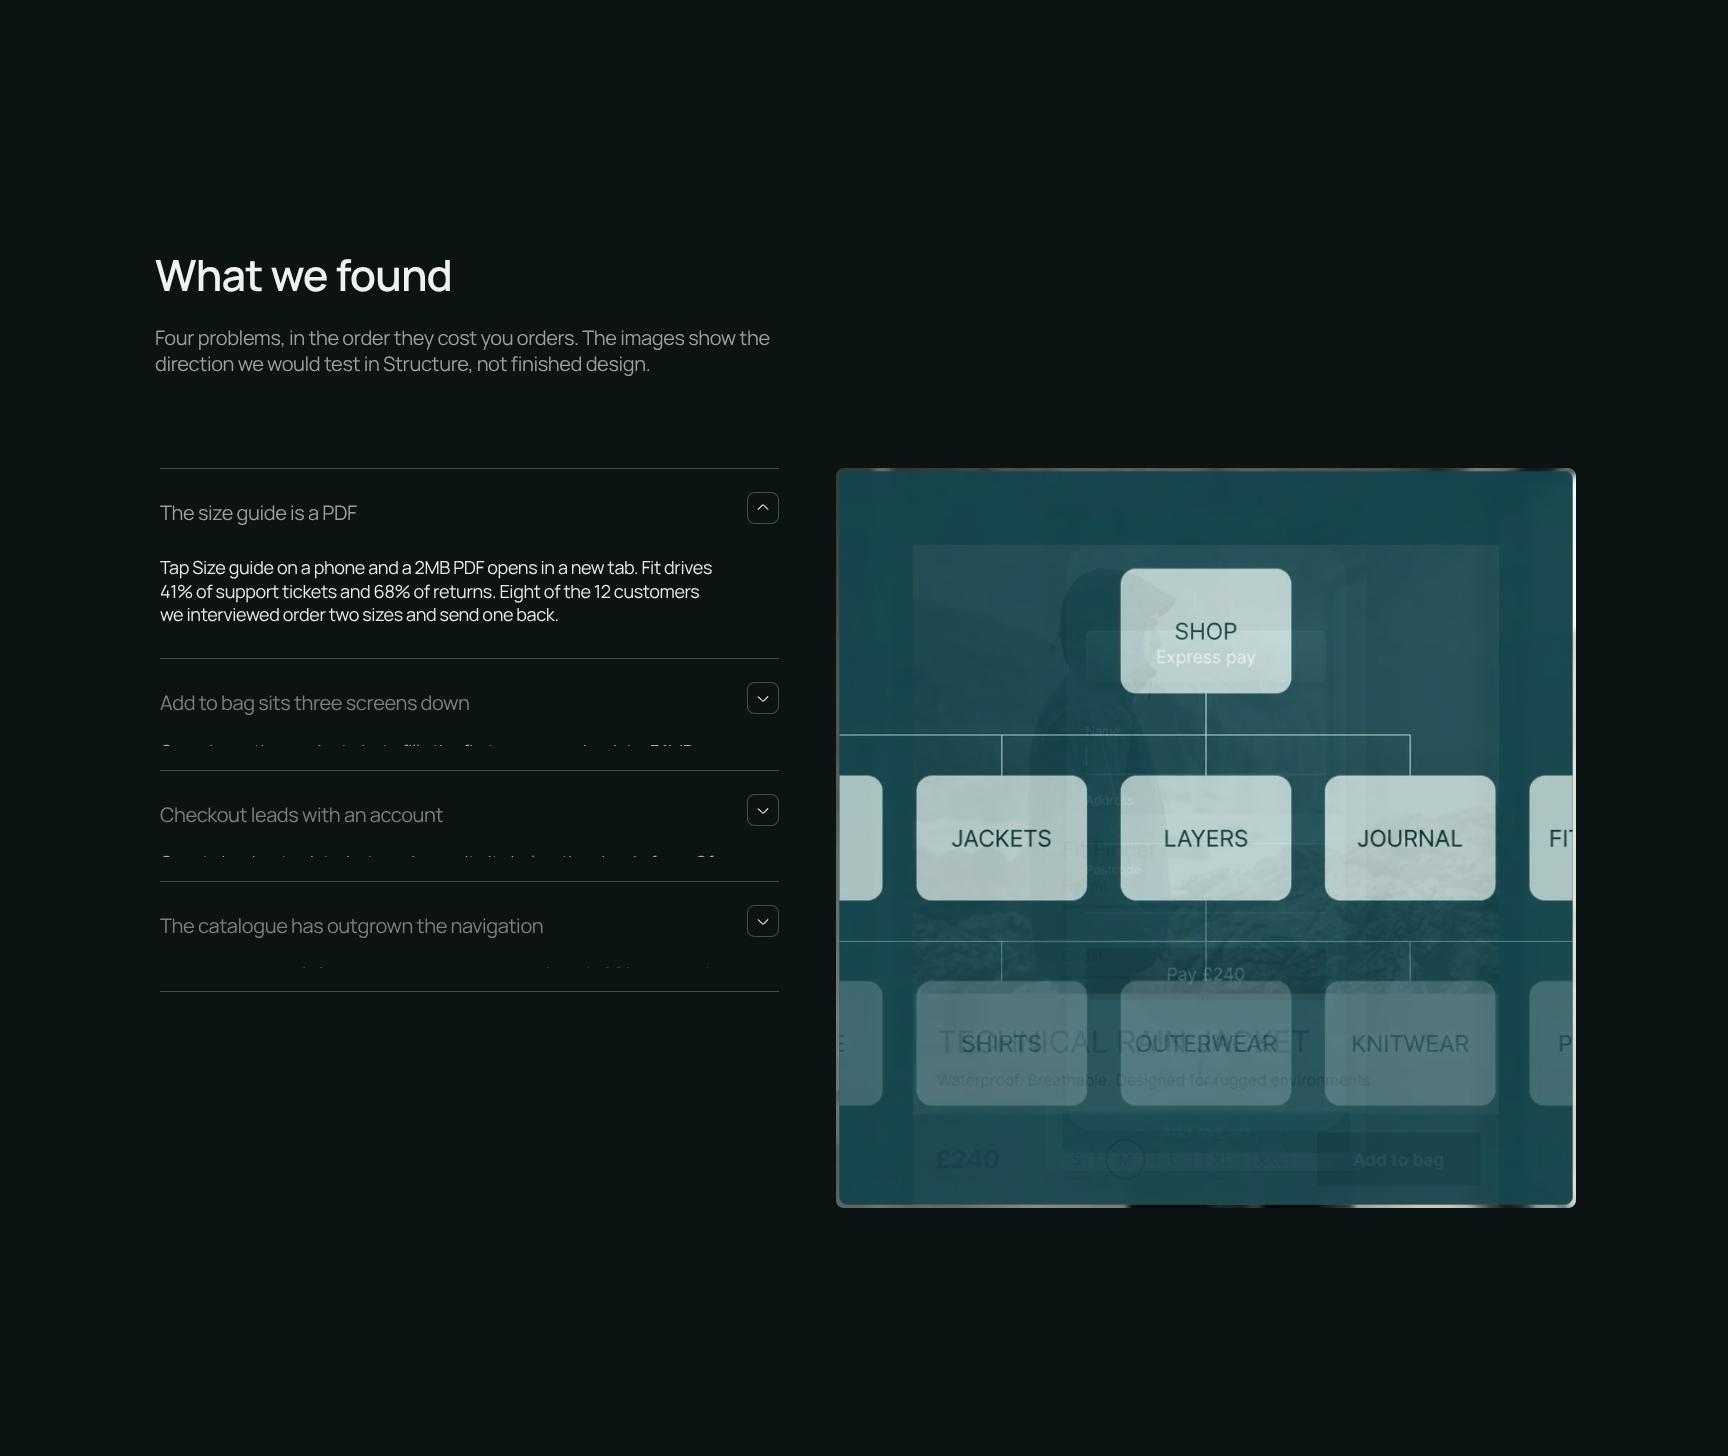
Ranked Findings: Four Conversion Problems with Design Direction
Four problems ordered by the orders they cost, each paired with directional images showing what we would test in Structure. Helps the client see priorities and likely solutions without mistaking them for finished design.
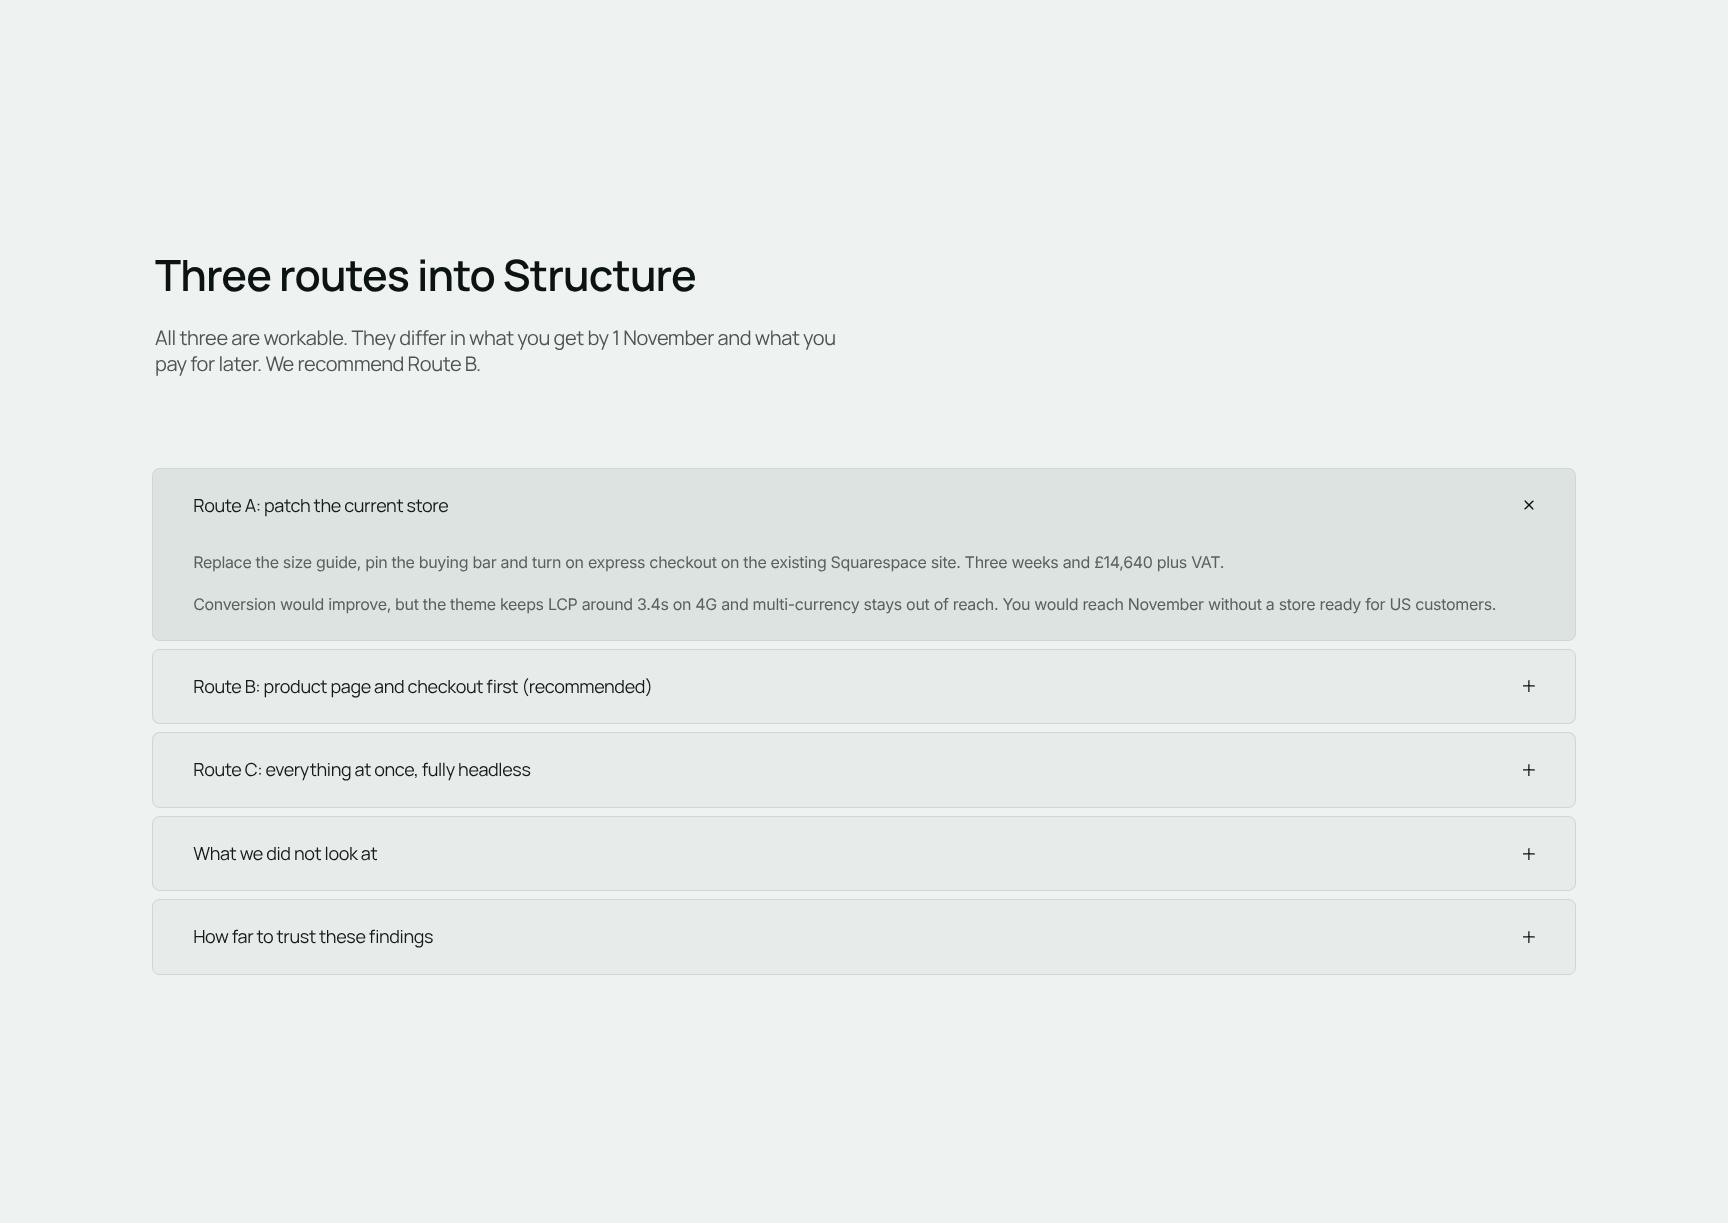
Route Options Comparison: Three Paths into Structure
An expandable accordion comparing Routes A, B and C by what is delivered by 1 November and what costs more later. Includes a clear recommendation for Route B so the client can decide with confidence.
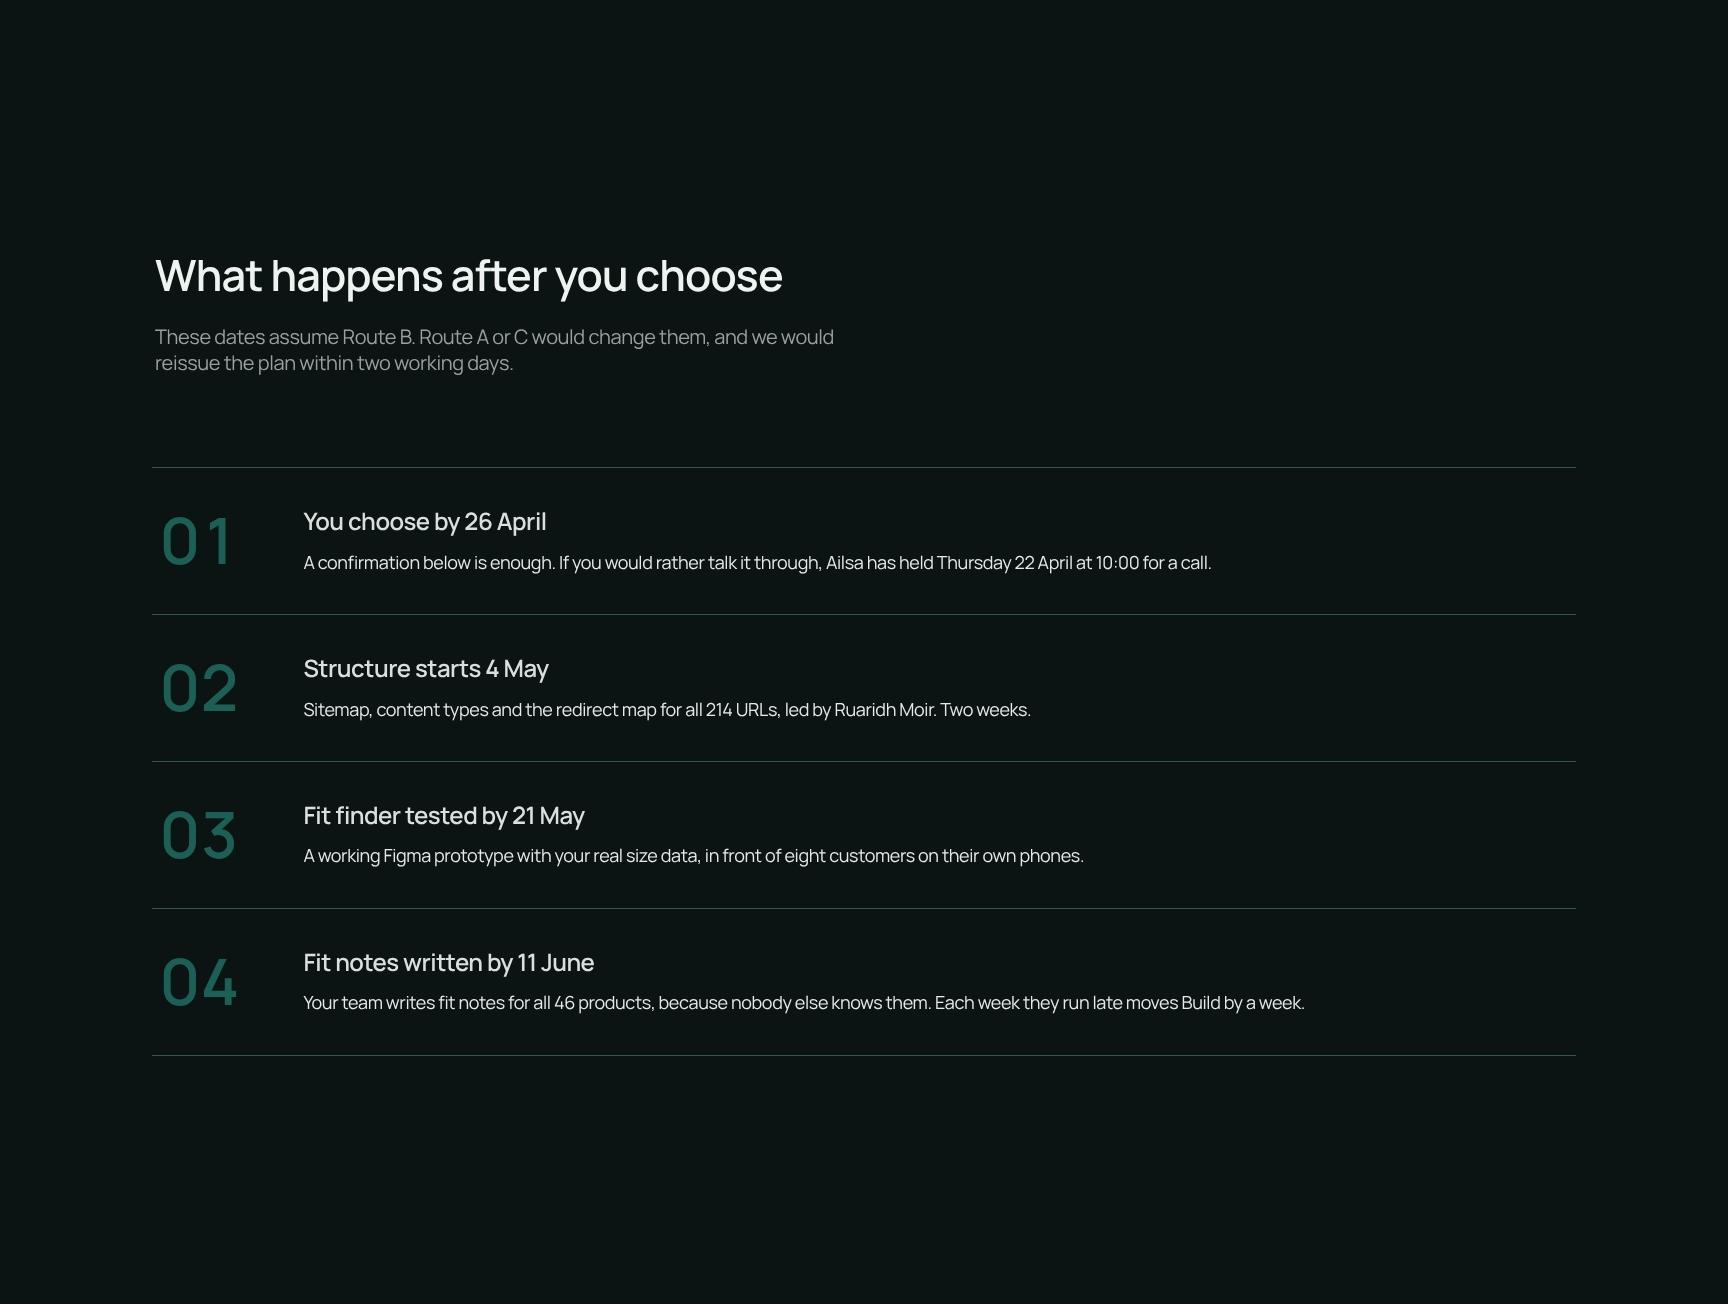
Next Steps Timeline: What Happens After You Choose
A step-by-step plan with dates assuming Route B, plus a commitment to reissue the plan within two working days if Route A or C is chosen. Removes uncertainty about delivery and timing.
Decision and Approval Sign-Off: Choose Route B by 26 April
A clear approval block to accept the findings and select Route B within the signed £68,400 plus VAT, with Structure starting 4 May. Includes the alternative path for A or C, making sign-off quick and unambiguous.
Find your answers
Answers to common questions about building discovery reports and client presentations with this template.
A strong findings report opens with the core question being answered, then presents key metrics, the main discovery, and supporting detail. This template covers that flow with six sections: The question, Four numbers, The one thing, Where sessions go, What we found, and Findings. Together they move readers from context to evidence to a clear conclusion.
Replace the placeholder text in each section with your own research question, metrics, and conclusions. Start with The question to define your scope, then fill in Four numbers with your most important KPIs. You can rename, reorder, or remove sections such as Where sessions go if they don't fit your project.
The Four numbers section highlights the four metrics that matter most to your audience, such as sessions, conversion rate, bounce rate, or average time on page. Choose numbers that directly answer your central question and that readers can understand at a glance. Limiting yourself to four keeps the report focused and prevents data overload.
Yes. The Where sessions go section is built for traffic flow, page paths, and user journey analysis, making it well suited to web analytics, UX research, and product reports. It also adapts to marketing, SaaS, and e-commerce reporting by swapping in your own metrics and findings.
State the single most important takeaway in one or two sentences, then link it to a specific recommended action. Lead with the insight, not the methodology, and back it with one supporting number from your data. This gives busy stakeholders a clear decision point without reading the full report.
Browse more digital & web design templates
More templates for presenting research, findings, and recommendations to clients who need to make a decision.